Appearance
Audit Page Permission: Security::Access
The Audit page provides insights into the security of your Project, including a Event Generation Timeline graph that illustrates the timeline of events triggered by workspaces within the current project. Additionally, the Live System Event Log presents a table displaying detailed logs of each event.
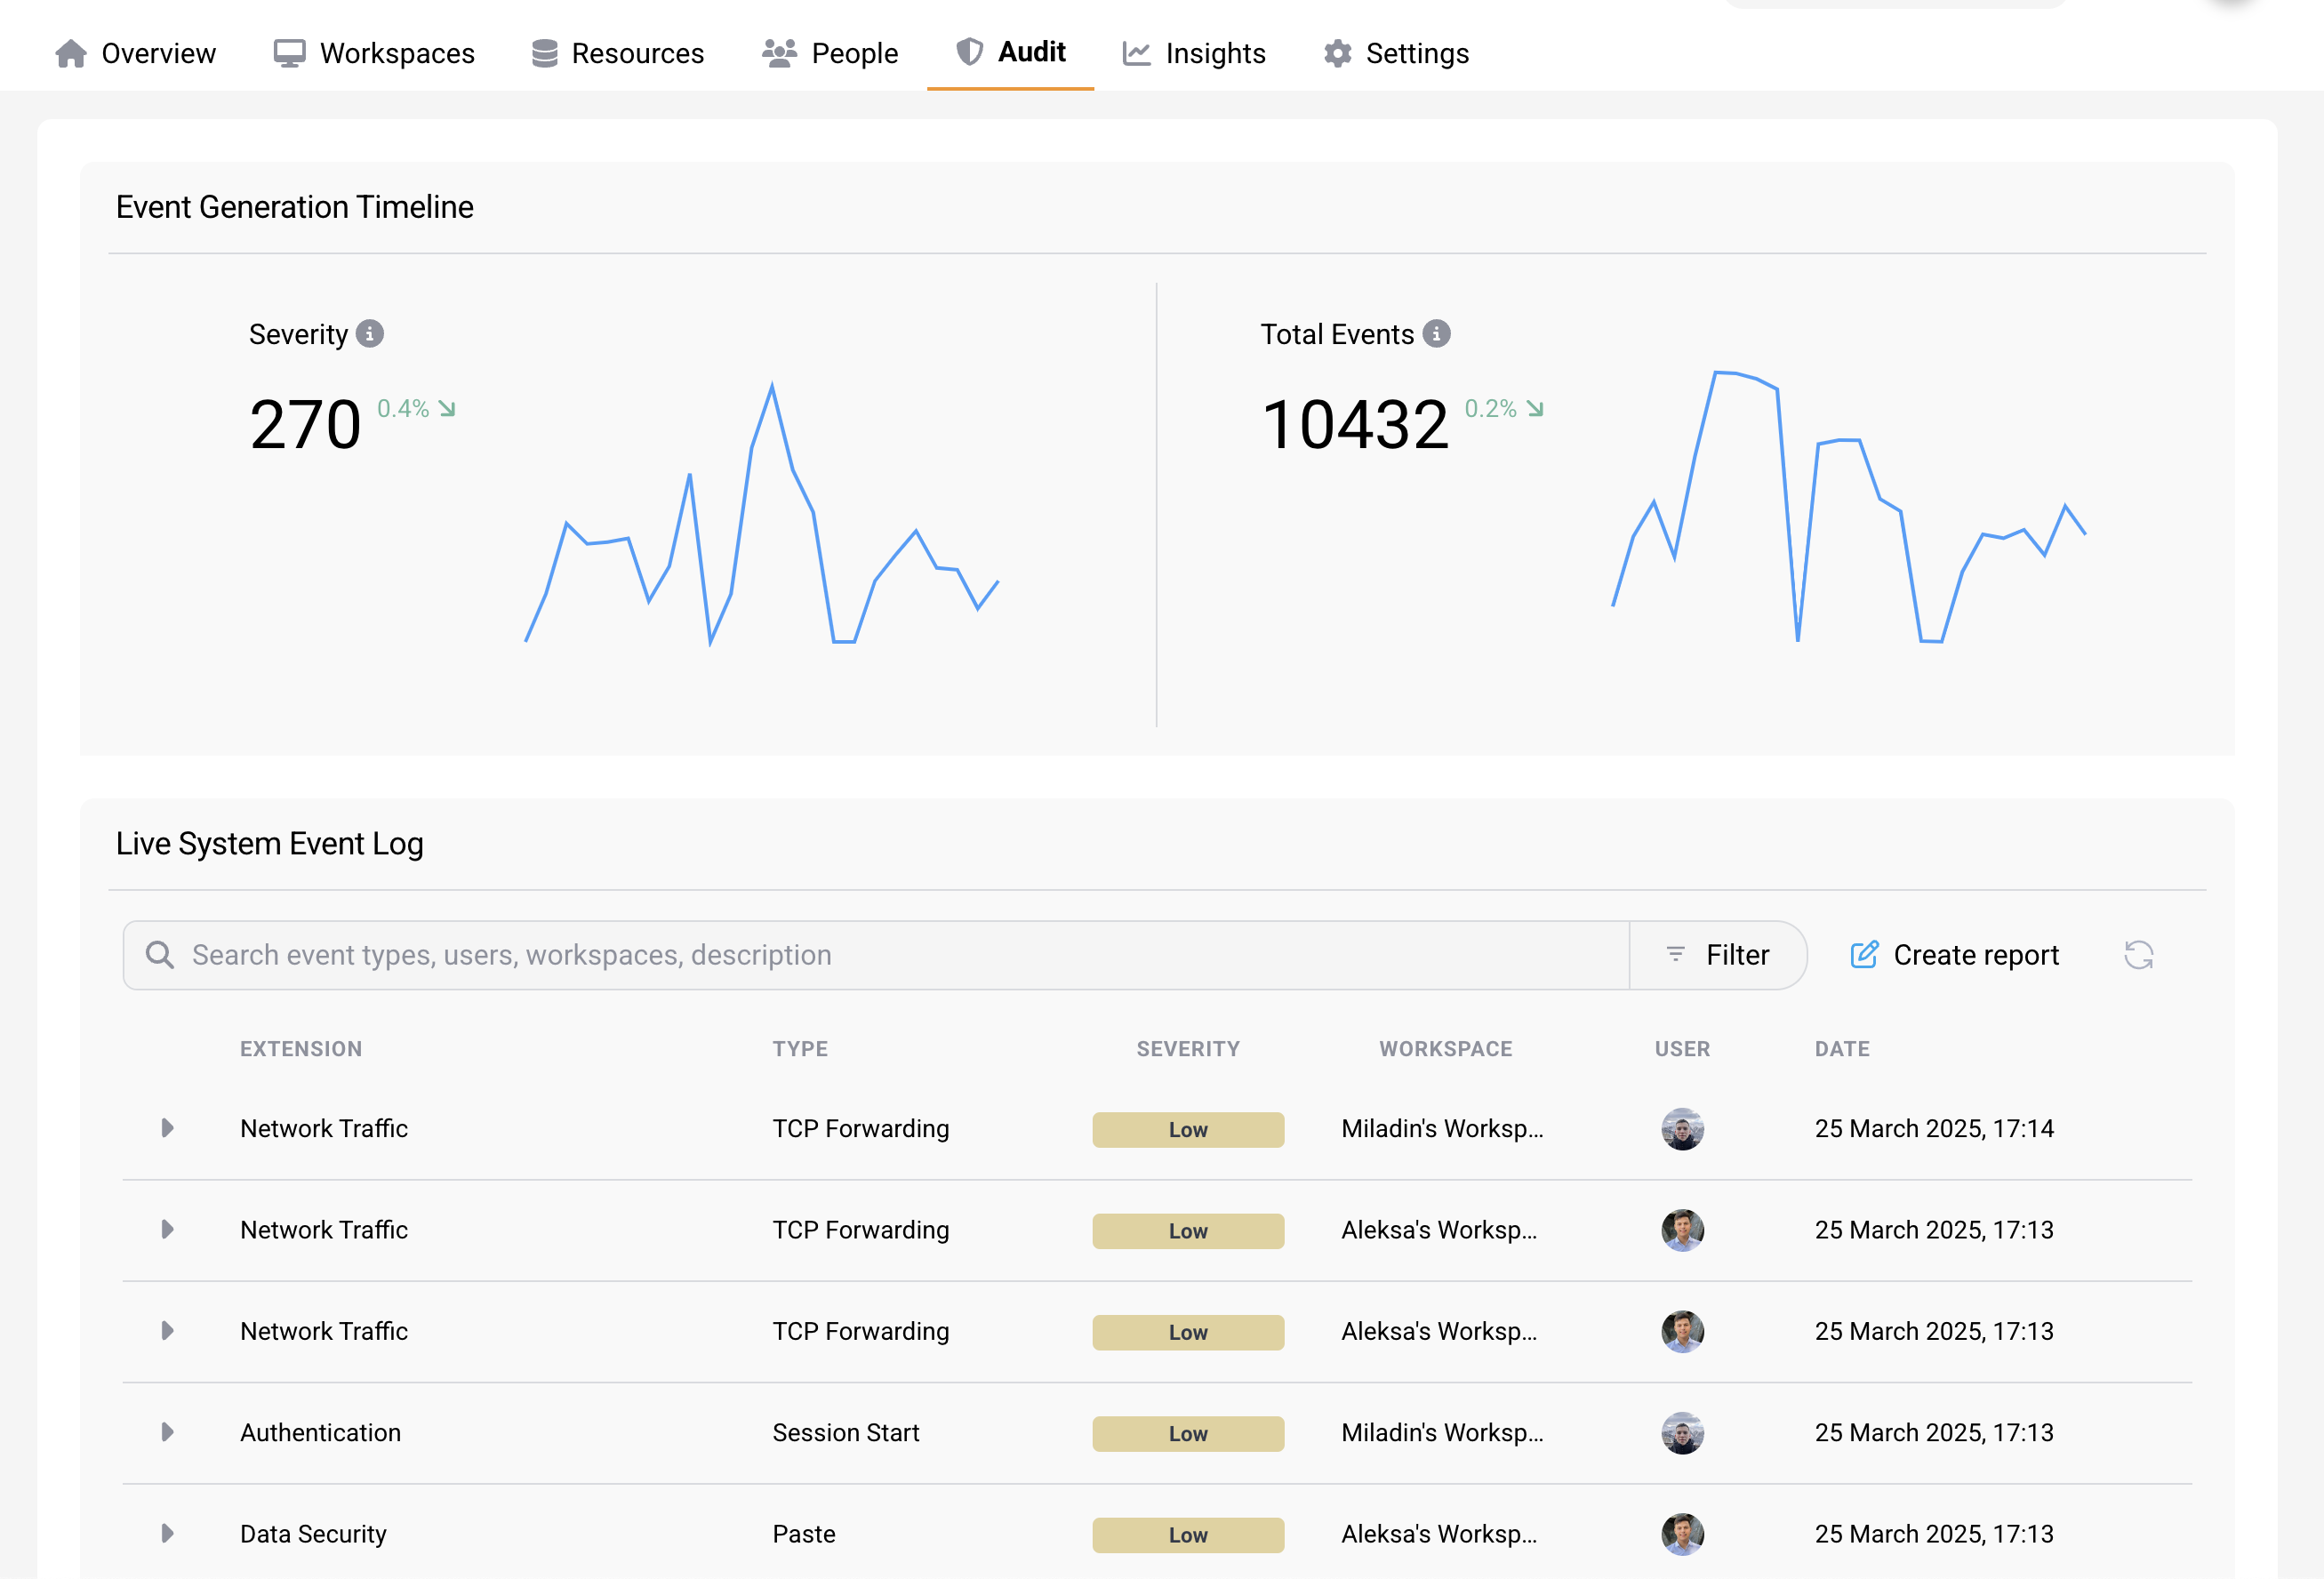 Audit Page
Event Generation Timeline
The event generation timeline are two graphs, where the first one shows the severity level of triggered events over time, and the other displays the total amount of triggered events over time.
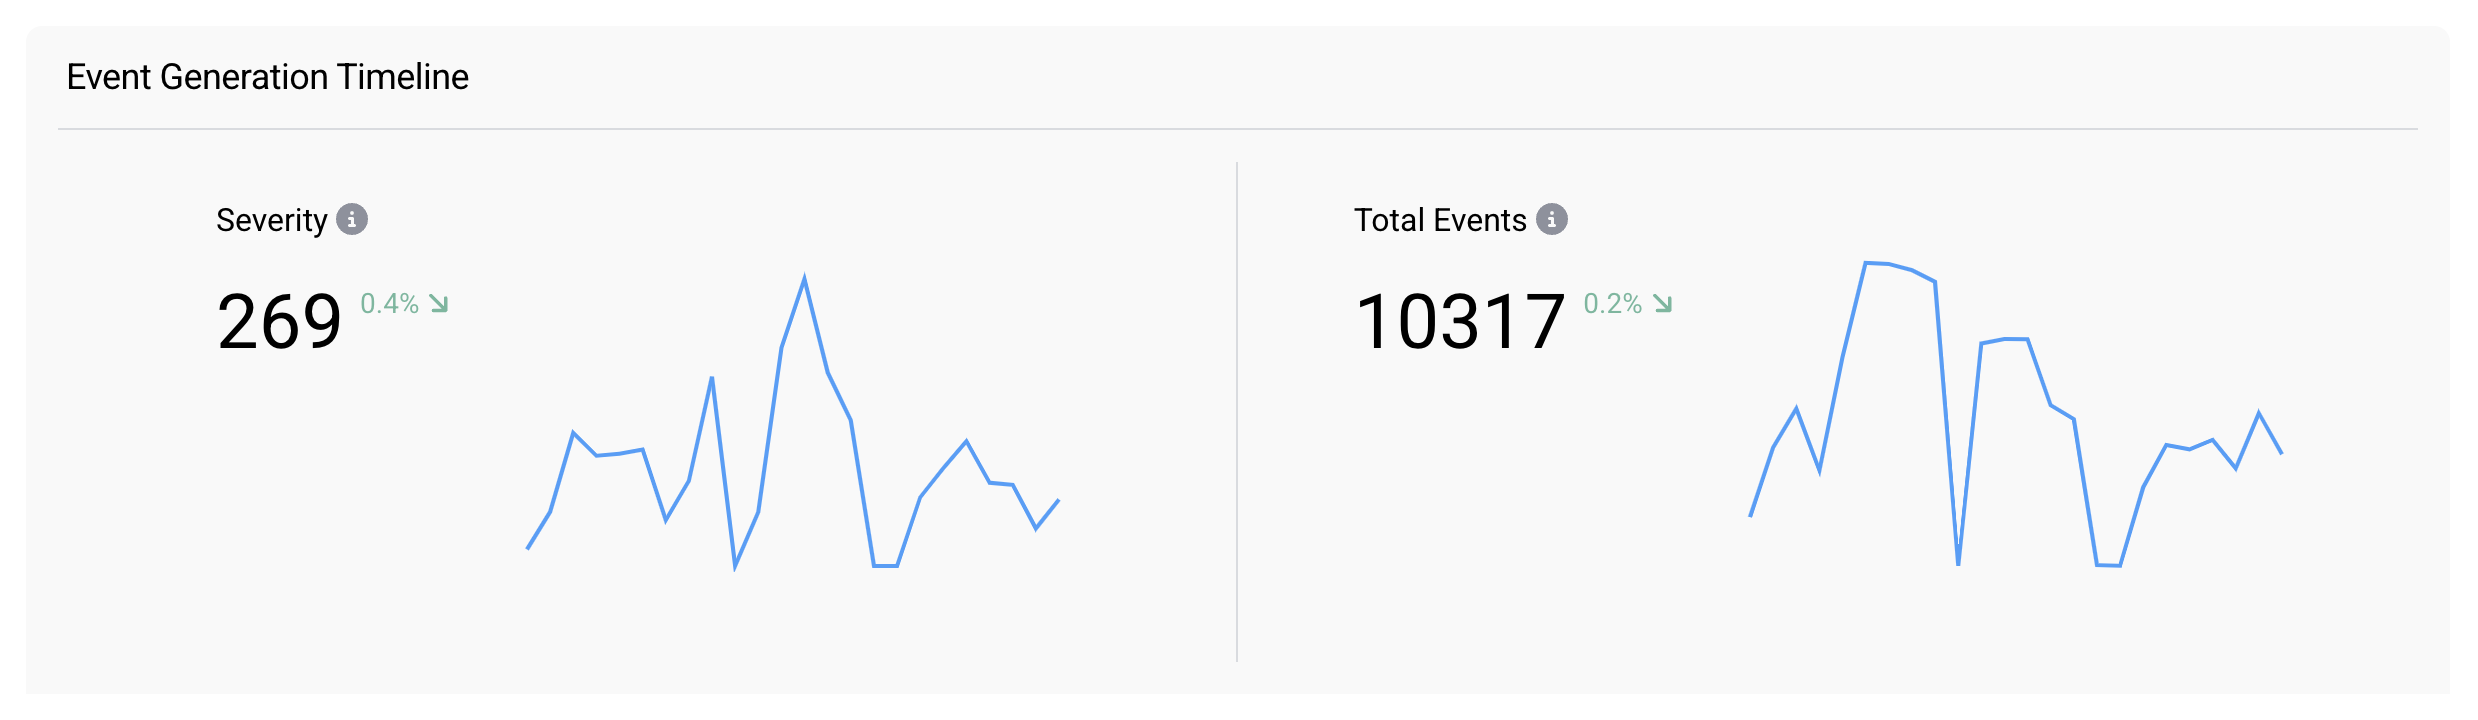 Event Generation Timeline
Event Logs
The Live System Event Log displays records of security events triggered by workspaces within a specific project. These events can take many forms, such as clipboard monitoring or network alerts, like a DNS request. These logs are significant as they have the ability to uncover potential security vulnerabilities.
TIP
Events are triggered once you enabled the option "Log and record outbound network traffic" for the associated Network Policy.
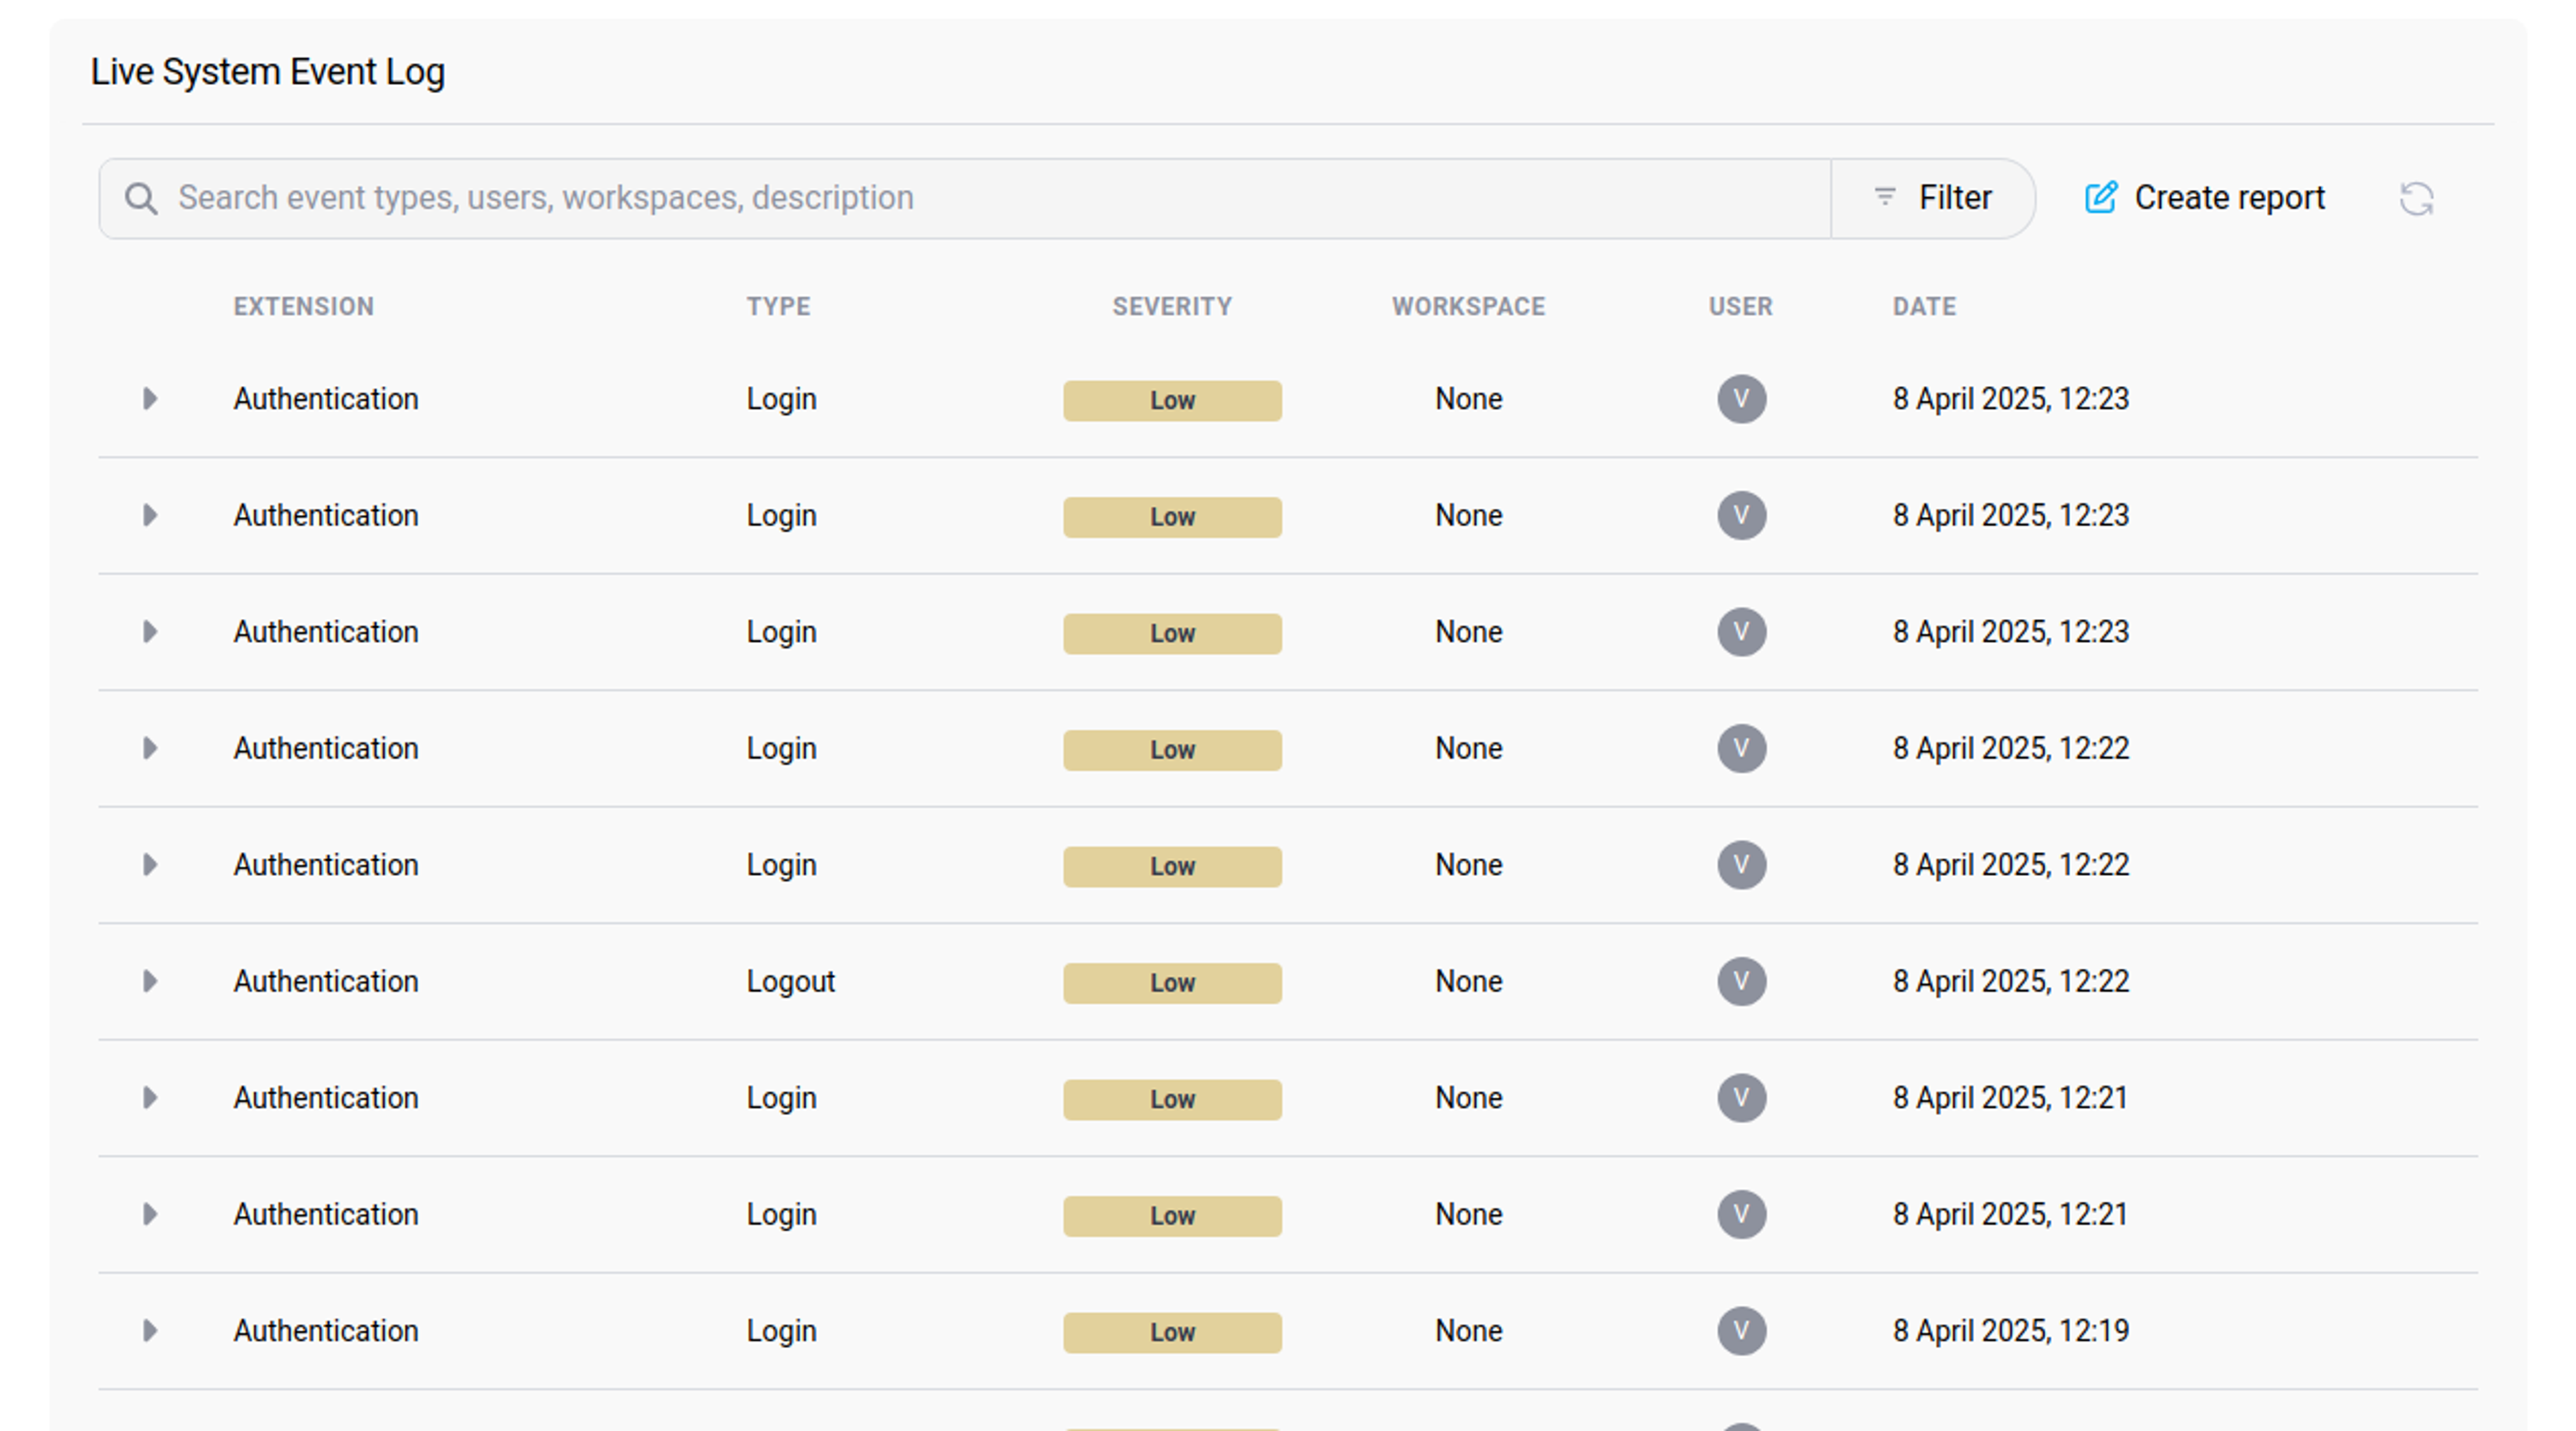 Live System Event Log
Filtering Logs
The log view allows users to easily filter and search through the system's event logs. This feature makes it very convenient to identify possible issues, troubleshoot and also to monitor the usage of the system in a more granular level. To display filter options, press the "Filter" button located at the top right of the Live System Event Log panel. Filter logs by:
- Type of the event,
- Severity level,
- Workspace from where the event was triggered,
- User that triggered the event,
- Date and time at which the event was triggered.
In addition to filtering logs, you can search through them by typing key words in the search bar below the date range (e.g. search for a specific user).
Log Display
The log view provides detailed information about each event that occurs within the system. For each log, you can view the following information:
- Type: What kind of event was triggered,
- Severity: Severity level of the event,
- Workspace: Workspace from where event was triggered,
- User: User who triggered the event,
- Date: Date and time at which the event was triggered,
- Description: Describes action that triggered the event.
To view more details about an event, press the dropdown menu button to the left of the event's log.