Appearance
Container Process Metrics
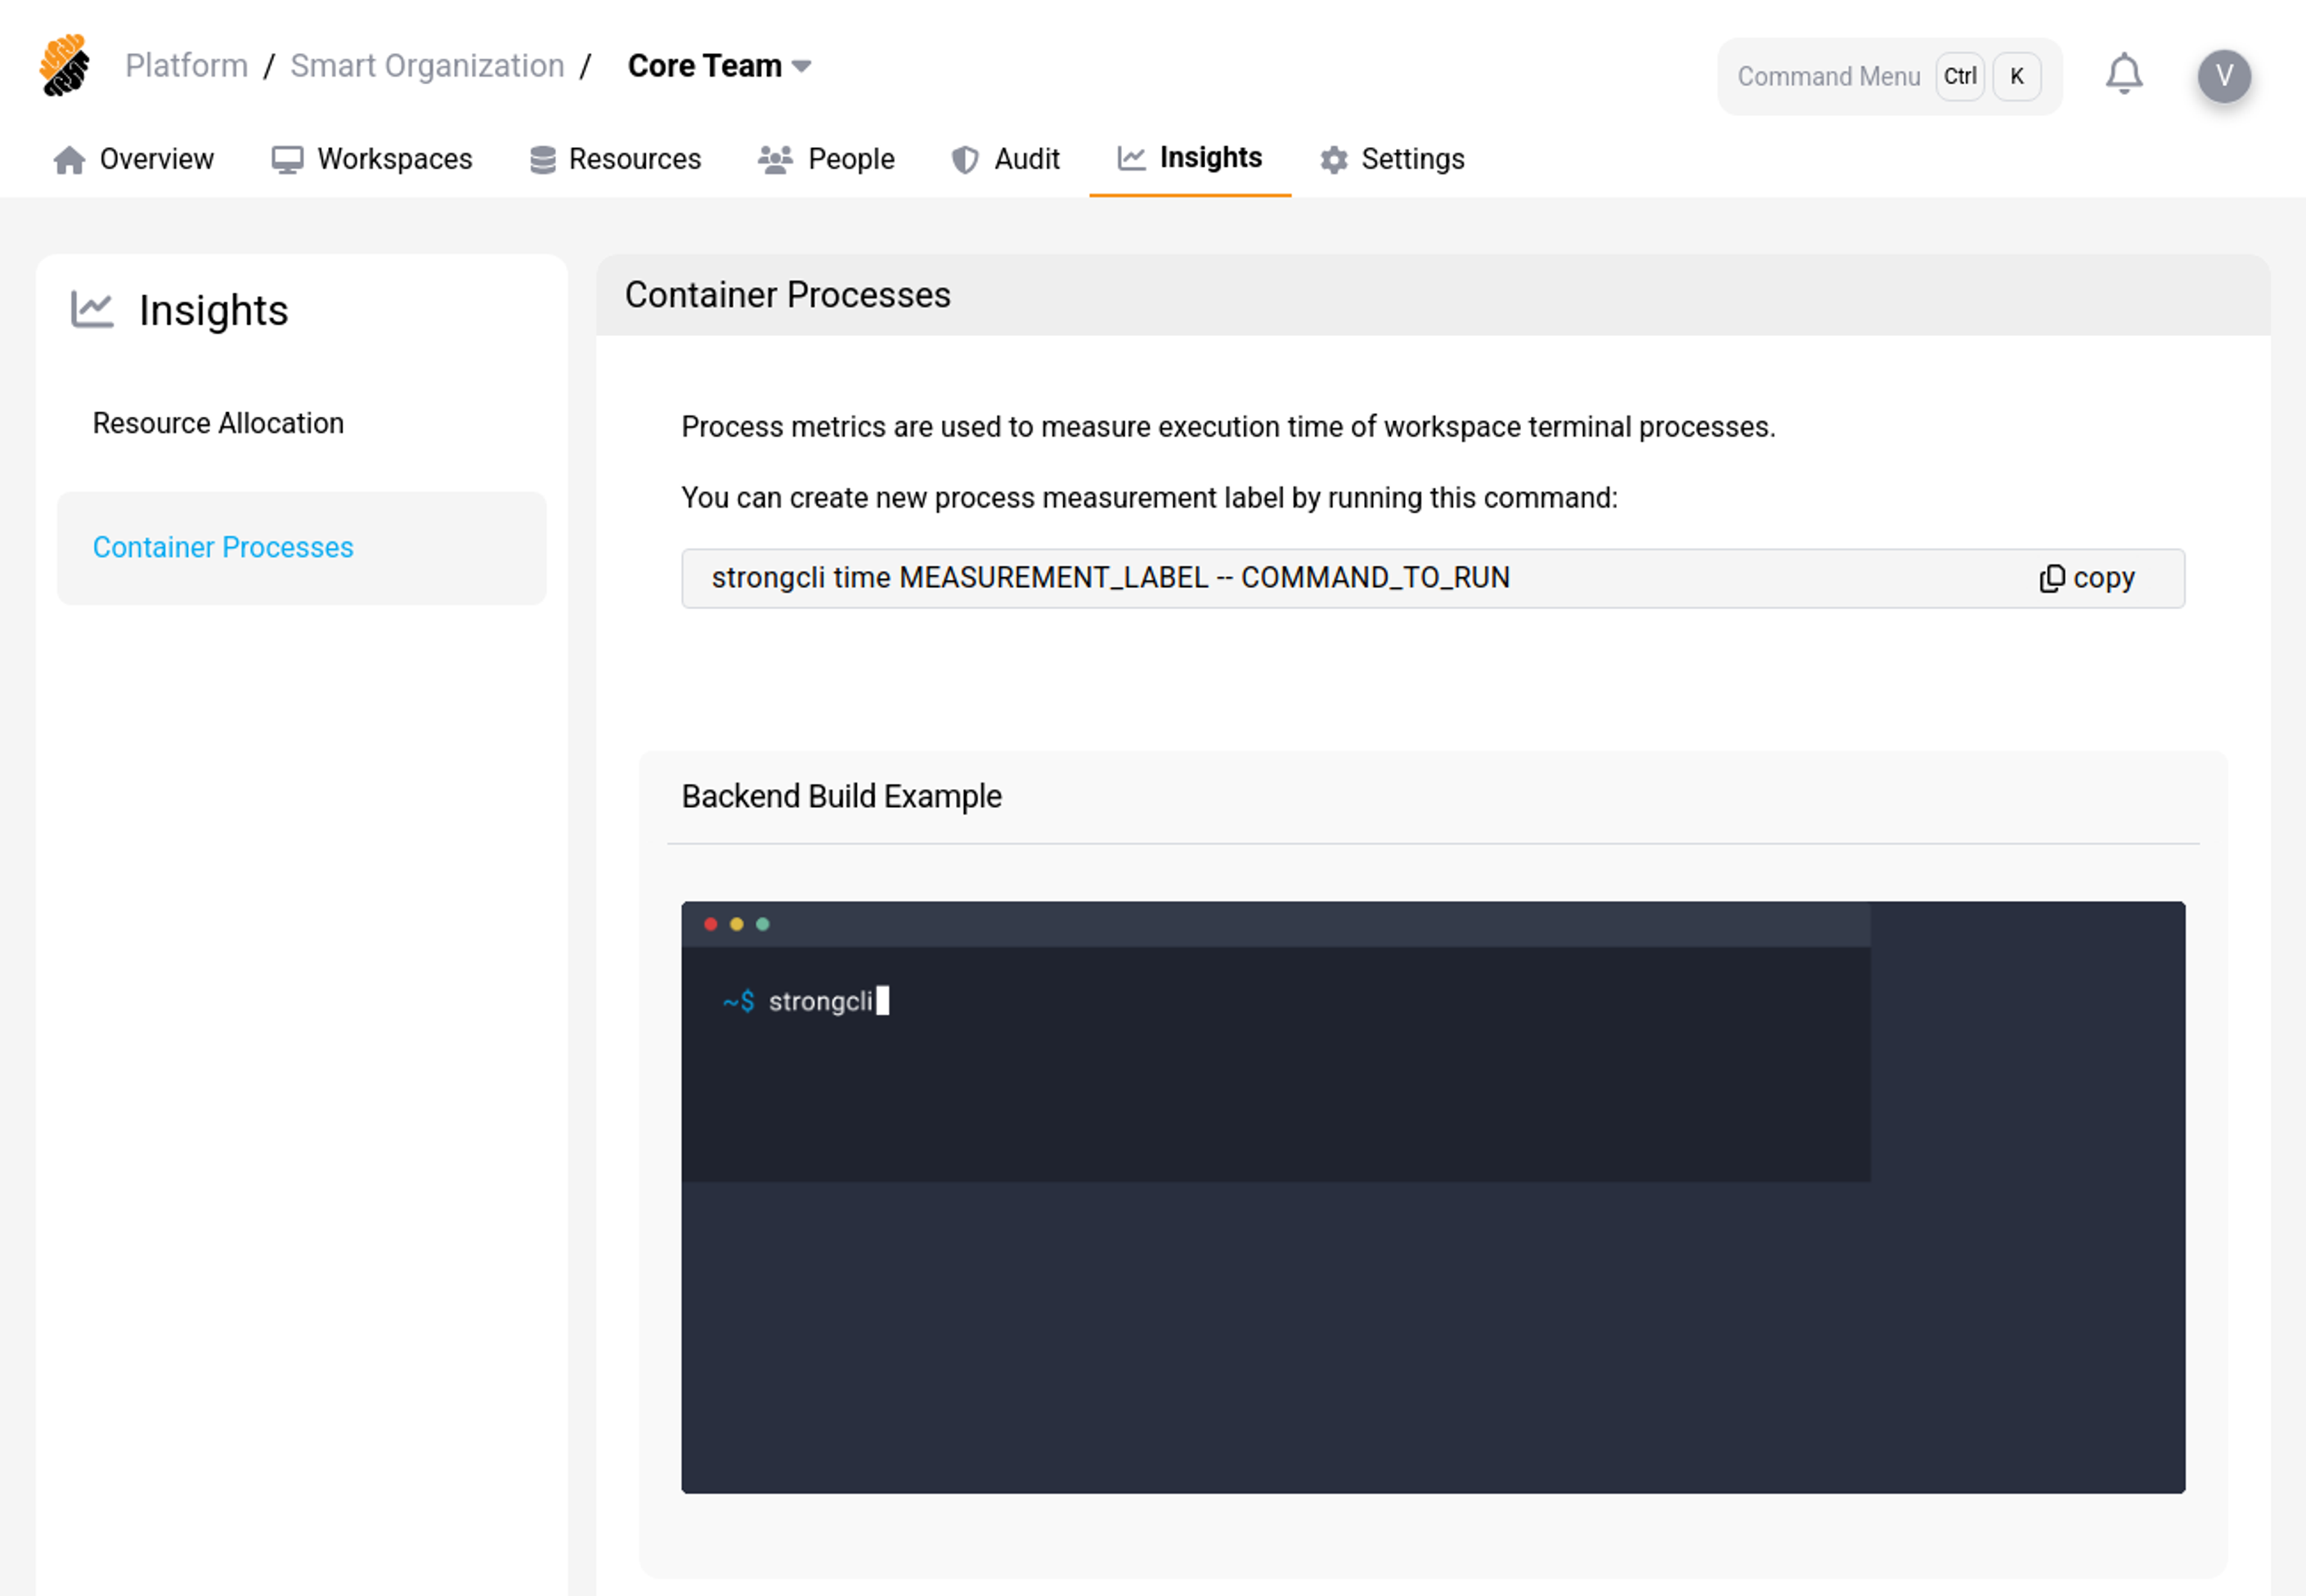
The section Container Process displays time metrics registered using the platform Command Line Interface (CLI) strongcli available in developers workspaces. Metrics are registered using the 'time' option and become available in the Insight dashboard's section Container Process. This CLI is typically used in scripts embedded in the project containers such that, at startup a selection of processes can be registered for performance assessment. Once registered in a fleet of workspaces, metrics are aggregated and eventually displayed in the Insights page.
 Container Process Metrics Page
Track a Container Process
You can track the execution time of container processes in workspaces using the platform's Command Line Interface (CLI) strongcli. Use the following command to do so:
> strongcli time LABEL -- COMMAND_TO_RUNWhere:
- LABEL: This allows setting a label to identify the process in the Insight dashboard,
- COMMAND_TO_RUN: The terminal command for which you would like to measure the execution time.
This registers a new process for your workspace among the container processes and measures its execution time.
Insights' Period
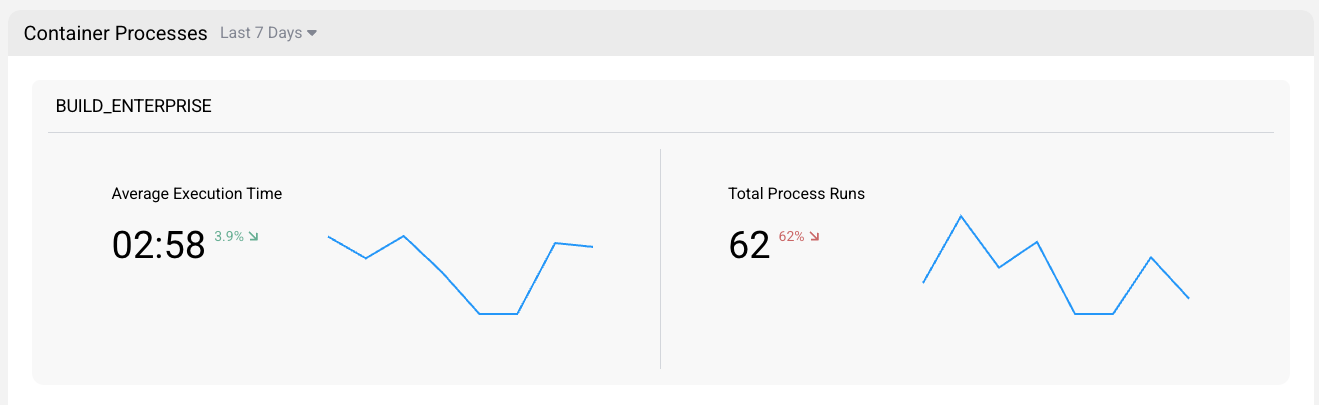
After selecting a container process, you can vary the span of the statistics from a 7-day execution average to a yearly average.
- Click on the drop-down menu to the right of "Last 7 days" to change the evaluation period.
 Container Insights' Period Selection
Based on selected period, the graph scale will be adapted accordingly.
Container Process Insights
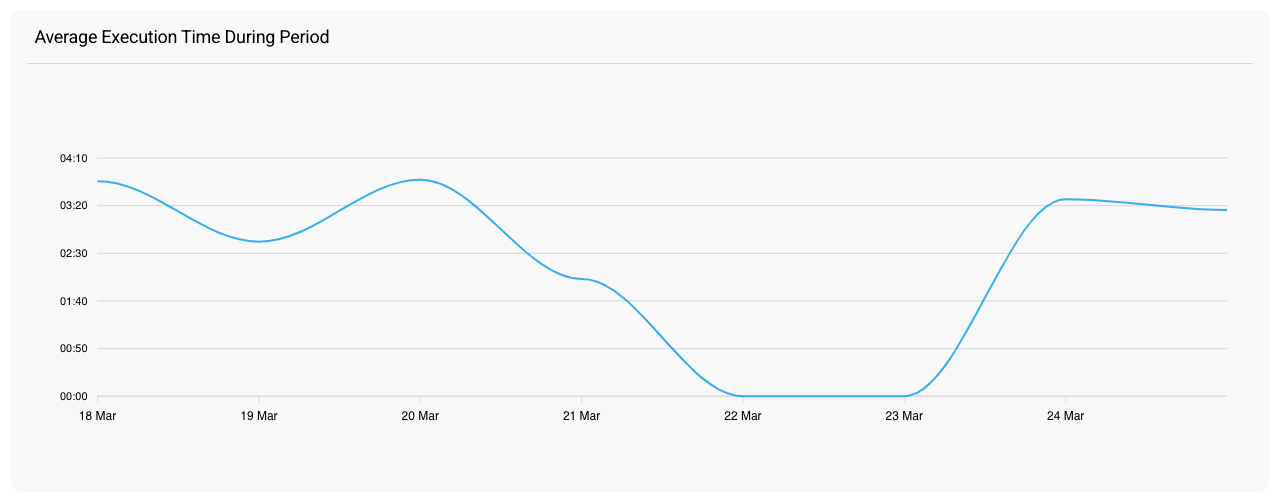
Average
The "average execution time" graph in the container Process section of the Insight dashboard shows the average amount of time it took for a command to be executed within a developer's workspace, as recorded by the platform's Command Line Interface (CLI). The period of time displayed on the average execution time graph can be adjusted, allowing you to view metrics for a specific date range.
 Average Container Process Insights
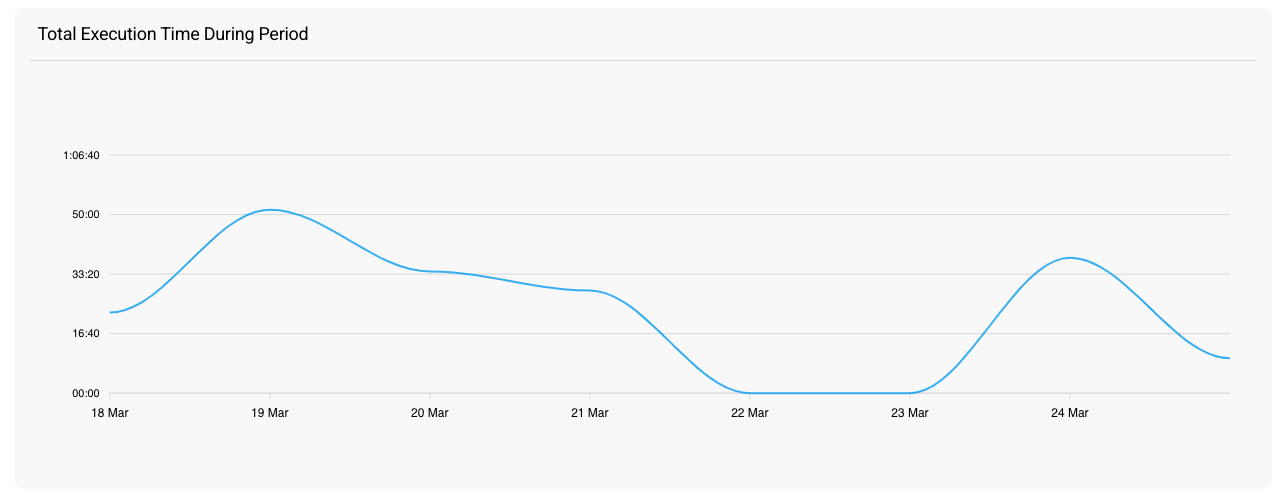
Total
The "total execution time" graph in the container process section of the Insight dashboard shows the total amount of time the command has been executed in a developer's workspace. The period of time displayed on the total execution time graph can be adjusted, allowing you to view metrics for a specific date range.
 Total Container Process Insights